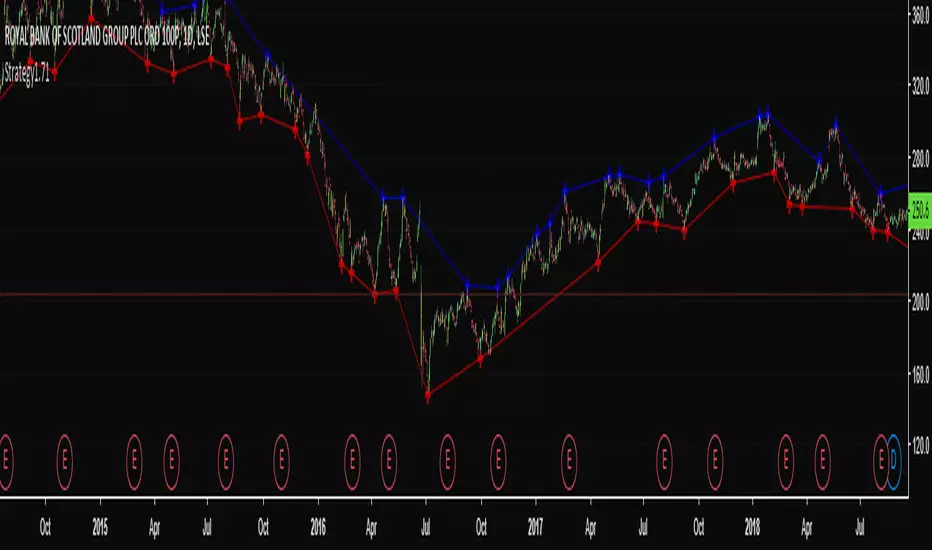
Montly 48/36/24/12 SMA and 48/30/20/10/5 EMA on 1D bars.This indicator is based on a combination of the popular SMA and EMA indicator.
The indicator is intended for use on a chart with 1 day candles and at stock exchange with a maximum history of prices.
The intervals of values are selected so that the chart with candles for 1 day contains information about the 48-month EMA and SMA, which is currently the highest available on the history. Price values between 48 MA's are highlighted in red. This is of great importance and the area between MA and MA is a strong support which may indicate market bottoms.
The borders of the decorated zones can be used as pivot points. Price trend may change when approaching the border of the zone. If the price has passed the zone, then the movement may continue.
在脚本中搜索"pivot points"

Divergence for many indicator v3Hello Everyone. Almost one year later, with Pine version 4, I developed new version of the Divergence for many Indicator.
It analyses divergences for 10 predefined indicators and then draws line on the graph. Red for negatif divergence (means prices may go down or trend reversal), Lime for positive divergences (means prices may go up or trend reversal)
Divergences version 2 has latency because it waits higher time frame completion. in this new version the script uses Pivot Points and on every bar it checks divergence between last Pivot point and current bar and if it finds any then immediately draws line and removes old one. so there is no latency with this version.
There are predefined 10 indicators in the script, you have option to choose which indicators the script would analyse for divergence. (RSI , MACD , MACD Histogram, Stochastic , CCI , Momentum, OBV, Diosc, VWMACD and CMF)
In replay mode you can see how the script puts new divergence line and removes old one. you better see it for yourself by using replay mode.
Hope you Enjoy!

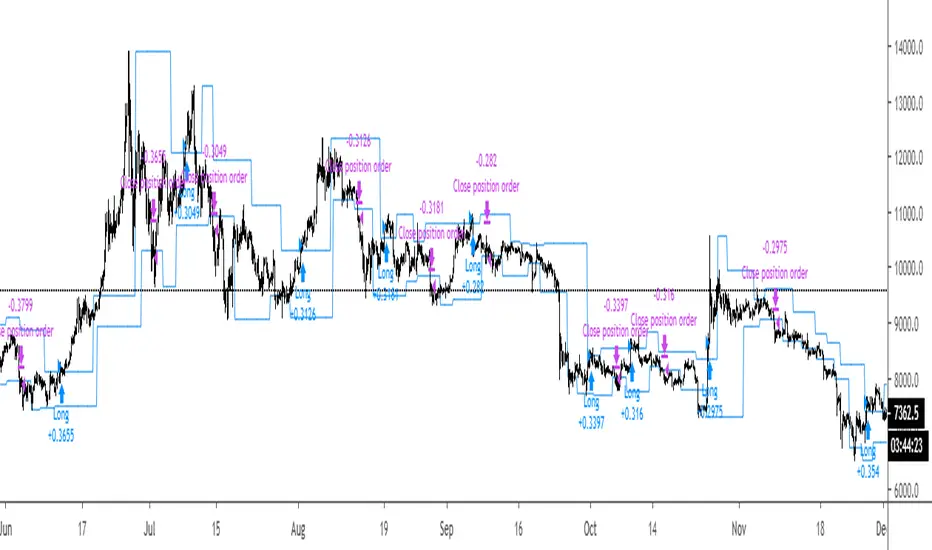
PivotBoss - Early Day PivotsCalculates the pivot points from the first N minutes of the day and overlays them over the entire day

Breakout Strategy #1Breakout above previous pivot points trigger a long. Close below pivot lows trigger the exit.
Most effective during trends.
[fikira] MACD & RSI+Stoch + DivergencesThis is a new version of my "Divergences"
Compared to my "Divergences (Pivots)", this is calculated totally different
There are 3 options:
- MACD
- RSI
- Stoch RSI
Since this script is very heavy in calculation it is limited in time (= inspired from a script of "Che_Trader")
Also it uses "max_bars_back" (=1000)
For MACD and Stoch RSI there is a "custom Divergences Period", which compares more then 7 Pivot Points,
the higher the number, the less reliable, it is not necessary to use this, but it is there,
also you can change the "leftbars" and "rightbars", again, it is not necessary to change, but you can...
Linewidth and style of the Divergences lines can be changed
Thank you!

[fikira] Harmonic Patterns 2This is "Harmonic Patterns", part 2 Open Source
(in 2 parts, otherwise many lines are gone because the script is too large):
- Crab
- Bat (+ Alt)
- Butterfly
- Shark
A "Pattern" is created by checking 5 consecutive ( pivot ) points, starting with X, A, B, C, and ending with point D.
At point D all 5 points are compared, calculated and verified.
When confirmed, a "Label" will be plotted at point D, together with the "Entry", "Take Profit" and "Stop Loss" price.
The "Entry", "Take Profit" and "Stop Loss" lines will be plotted as well at point D.
Lastly, a "Drawing" automatically will be displayed which makes the "Pattern" visible.
Please do mind, the "Drawing" is calculated differently, the "Drawing" sometimes can be displayed incorrectly
when prices are too close to each other (for example low Satoshi price changes).
THE "ENTRY", "TAKE PROFIT", "STOP LOSS" PRICES AND LINES ARE NOT AFFECTED AT ALL BY THIS, THEY WILL SHOW CORRECTLY!
- 1 "TP point" can be changed ("TP Level 0.618")
- "Labels", "Lines", "Drawings" can be disabled/enabled
- "Labels" can be made smaller or bigger ("Size Label")
- "Labels" can be placed further or closer to the bar ("Distance TP Label" > higher = closer, lower = further)
- "Lines" can be made thicker or thinner ("TP Linewidth")
- "Drawings" can be made thicker or thinner ("Drawings Linewidth")
- "Drawings" are created by comparing with 100 bars back in history (default), should it be (very rarely) a triangle is displayed flat on the left side,
possibly the first point(s) is/are further than 100 bars ago, in this case increase "Period Drawings" above 100.
- Animal symbols can be enabled/disabled
- When several "Patterns" appear on the chart, the oldest ones won't be displayed anymore, first the "Drawings", then the "Lines"
The last (present) ones will always be displayed in total without a problem!
- If you want to see "Patterns" with less correct measurement, change "Error Marge" 0.9 - 1" and "Error Marge" 1 - 1.1"), this gives max. about 10% extra margin
- Added more settings regarding "Drawing Lines"
Thank you very much!

[fikira] Harmonic Patterns 1When using "Harmonic Patterns", always look at the bigger picture, please do not depend solely on the "Pattern".
Use other indicators,... to confirm what you think is going on!
That said, it is quite useful!
Beside my "The Gartley", now, OPEN SOURCE, we have "Harmonic Patterns" in 2 parts (otherwise many lines are gone because the script is too large)
- ABCD
- Gartley
- Cypher
- 5.0
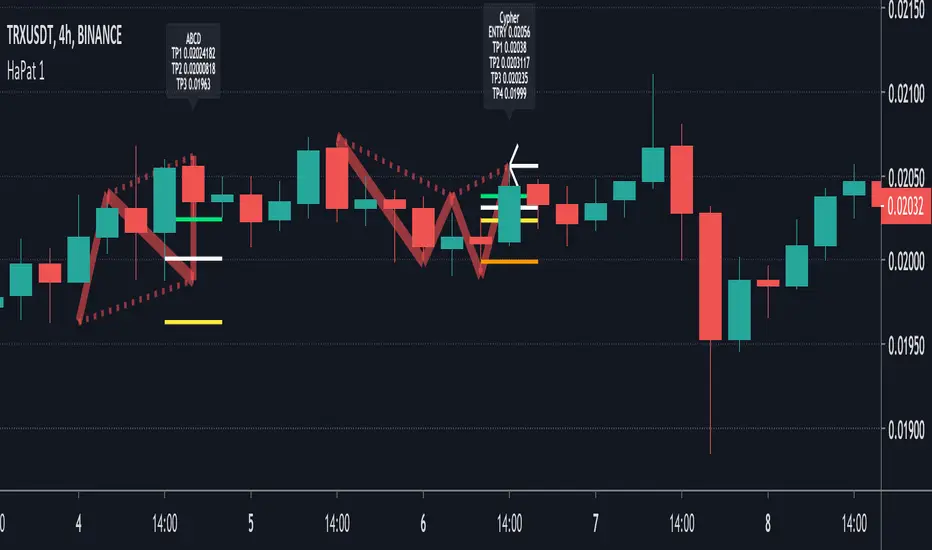
A "Pattern" is created by checking 5 consecutive ( pivot ) points, starting with X, A, B, C, and ending with point D.
At point D all 5 points are compared, calculated and verified.
When confirmed, a "Label" will be plotted at point D, together with the "Entry", "Take Profit" and "Stop Loss" price.
The "Entry", "Take Profit" and "Stop Loss" lines will be plotted as well at point D.
Lastly, a "Drawing" automatically will be displayed which makes the "Pattern" visible.
Please do mind, the "Drawing" is calculated differently, the "Drawing" sometimes can be displayed incorrectly
when prices are too close to each other (for example low Satoshi price changes).
THE "ENTRY", "TAKE PROFIT", "STOP LOSS" PRICES AND LINES ARE NOT AFFECTED AT ALL BY THIS, THEY WILL SHOW CORRECTLY!
- 1 "TP point" can be changed ("TP Level 0.618")
- "Labels", "Lines", "Drawings" can be disabled/enabled
- "Labels" can be made smaller or bigger ("Size Label")
- "Labels" can be placed further or closer to the bar ("Distance TP Label" > higher = closer, lower = further)
- "Lines" can be made thicker or thinner ("TP Linewidth")
- "Drawings" can be made thicker or thinner ("Drawings Linewidth")
- "Drawings" are created by comparing with 100 bars back in history (default), should it be (very rarely) a triangle is displayed flat on the left side,
possibly the first point(s) is/are further than 100 bars ago, in this case increase "Period Drawings" above 100.
- When several "Patterns" appear on the chart, the oldest ones won't be displayed anymore, first the "Drawings", then the "Lines"
The last (present) ones will always be displayed in total without a problem!
- If you want to see "Patterns" with less correct measurement, change "Error Marge" 0.9 - 1" and "Error Marge" 1 - 1.1"), this gives max. about 10% extra margin
- Added more settings regarding "Drawing Lines"
Thank you very much!
Technical Analysis - Panel Info//A. Oscillators & B. Moving Averages base on TradingView's Technical Analysis by ThiagoSchmitz
//C.Pivot base on Ultimate Pivot Points Alerts by elbartt
//D. Summary & Panel info by anhnguyen14
Panel Info base on these indicators:
A. Oscillators
1. Rsi (14)
2. Stochastic (14,3,3)
3. CCI (20)
4. ADX (14)
5. AO
6. Momentum (10)
7. MACD (12,26)
8. Stoch RSI (3,3,14,14)
9. %R (14)
10. Bull bear
11. UO (7,14,28)
B. Moving Averages
1. SMA & EMA: 5-10-20-30-50-100-200
2. Ichimoku Cloud - Baseline (26)
3. Hull MA (9)
C. Pivot
1. Traditional
2. Fibonacci
3. Woodie
4. Camarilla
D. Summary
Sum_red=A_red+B_red+C_red
Sum_blue=A_blue+B_blue+C_blue
sell_point=(Sum_red/32)*100
buy_point=(Sum_blue/32)*100
sell =
Sum_red>Sum_blue
and sell_point>50
Strong_sell =
A_red>A_blue
and B_red>B_blue
and C_red>C_blue
and sell_point>50
and not crossunder(sell_point,75)
buy =
Sum_red>Sum_blue
and buy_point>50
Strong_buy =
A_red50
and not crossunder(buy_point,75)
neutral = not sell and not Strong_sell and not buy and not Strong_buy


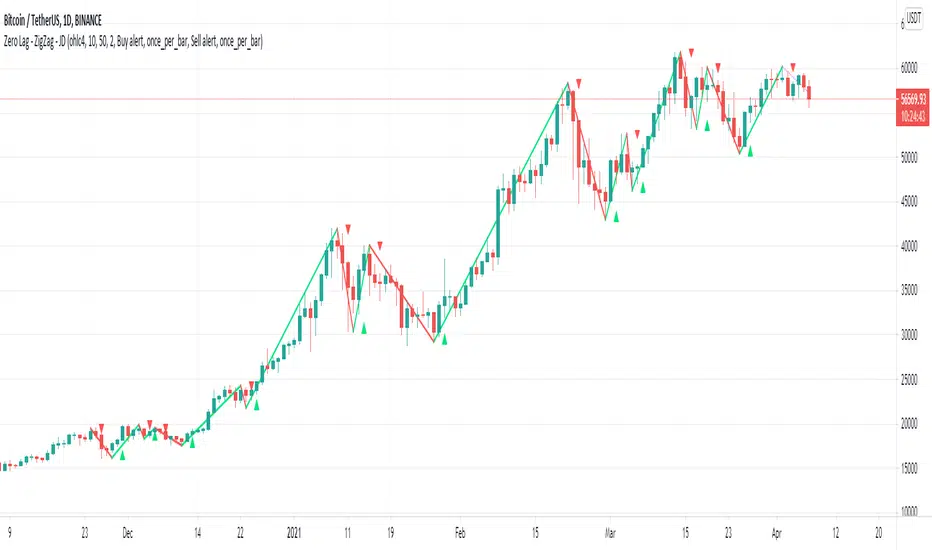
Zero Lag - ZigZag - JDThis is a alternative version of the well known "ZigZag indicator" but it uses turning points of the Jurik ma
instead of the traditional "pivot points" that are by definition lagging by a large lookback period, the (almost-) Zero Lag ZigZag lags by about 2 bars on average (depending on the candles forming)
The ZigZag pattern can be used to draw trendlines and S/R lines
It can also be used for "wave counting" in a way that reduces interpretation.
If you find other uses, please leave your ideas in the comments!
Shoutout to Everget for the awesome Jurik code!!
JD.
#NotTradingAdvice #DYOR
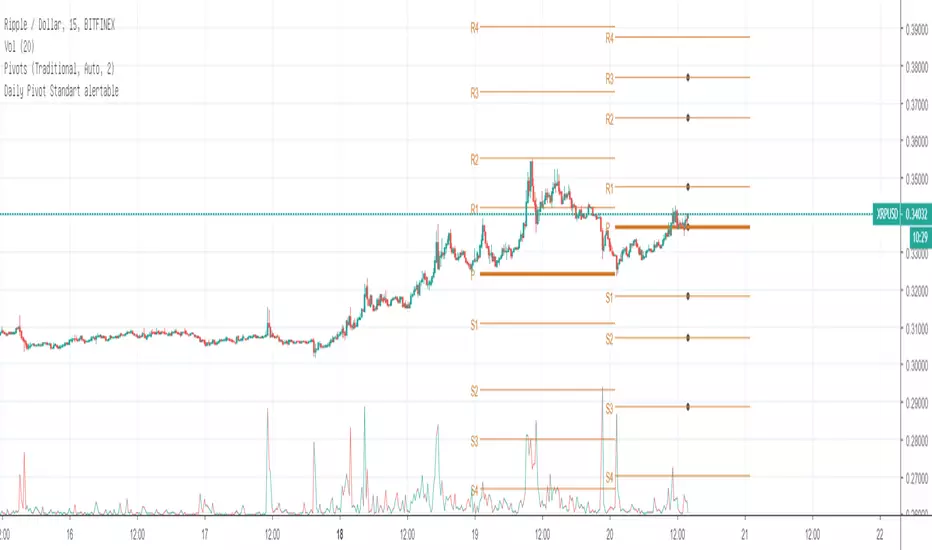
Daily Pivot Standart alertableWith this Indicator u can set allert between the Pivot points s15.directupload.net
So it is useful for scalping
High & Low Pivot Strategy v1.0A system that determines what direction the market is trending by analysing previous high and low pivot points to set up an entry trade.
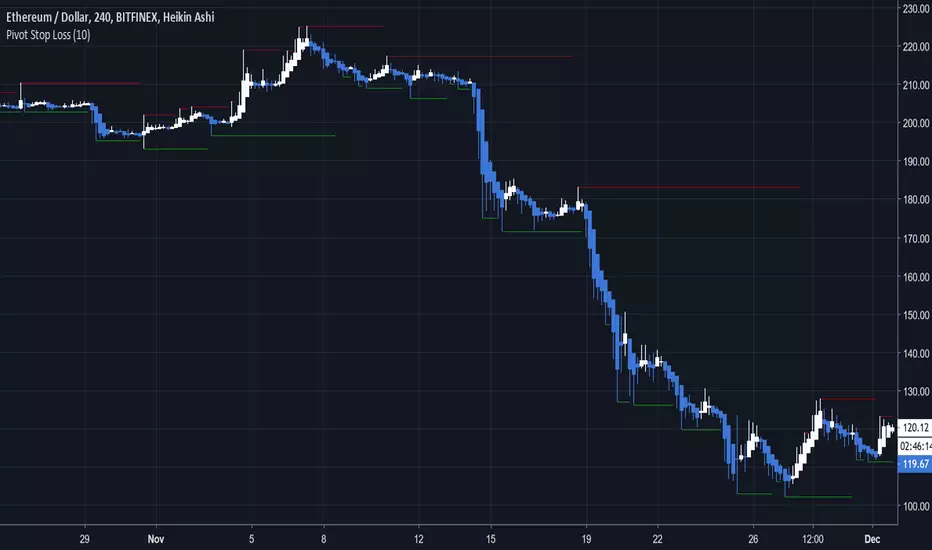
Pivot Stop LossHere we intend to use pivot points for stop loss and take profit. This has the added benefit of helping you to visualize support and resistance levels.
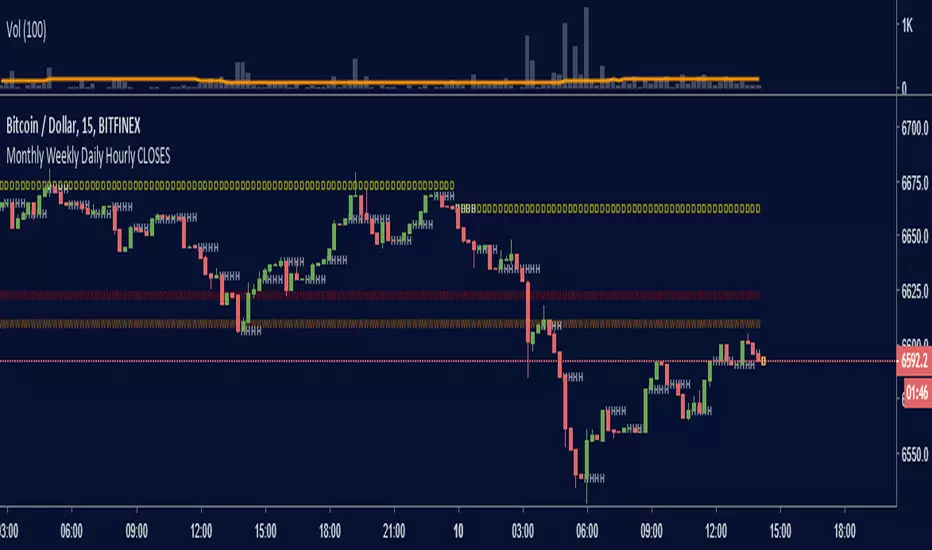
Monthly Weekly Daily Hourly CLOSESDraws horizontal segments where the last Monthly, Weekly, Daily and Hourly closes are.
Easily identify current price relative position to these key prices.
I use it as a kind of pivot points and help me with trend following entries: longs if up from last close, shorts if down from last close.
Monthly: red line (MMMMM)
Weekly: orange line (WWWWW)
Daily: yellow line (DDDDD)
Hourly: white line (HHHHH)
//Original idea from "Key Levels
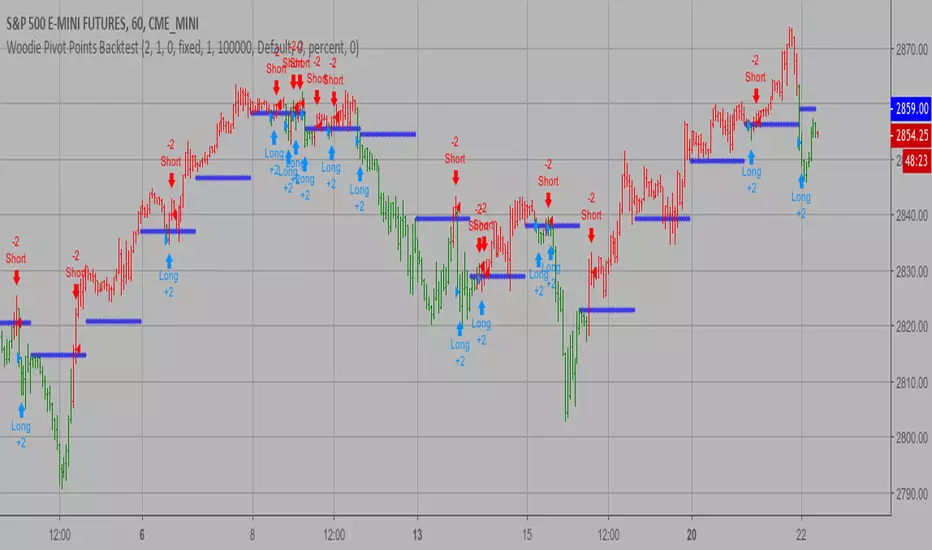
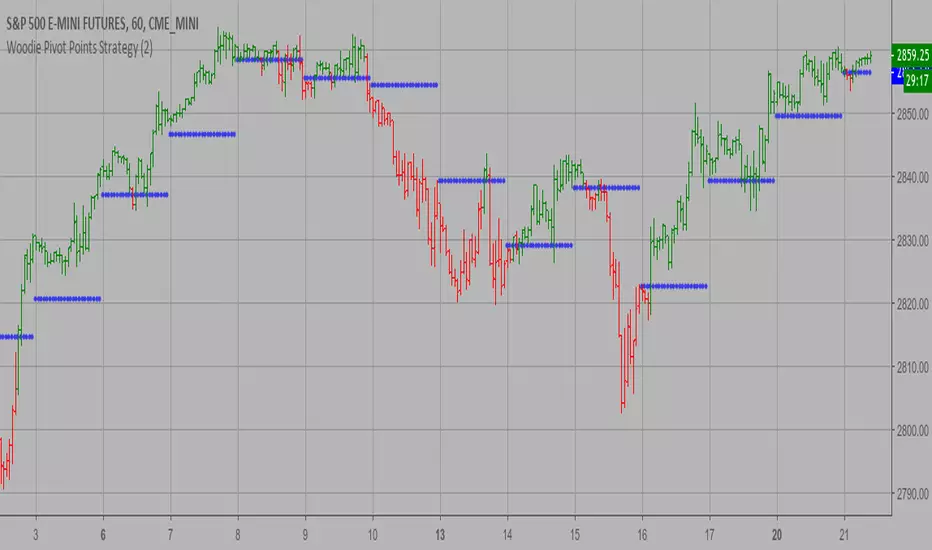
Woodie Pivot Points Backtest Simply input the vales of the high, low and closing price of the previous
period to calculate the Woodie pivot point and the associated resistance
and support levels for the present period.
You can change long to short in the Input Settings
WARNING:
- For purpose educate only
- This script to change bars colors.
Woodie Pivot Points Strategy Simply input the vales of the high, low and closing price of the previous
period to calculate the Woodie pivot point and the associated resistance
and support levels for the present period.
WARNING:
- This script to change bars colors.

Woodie Pivot Points Simply input the vales of the high, low and closing price of the previous
period to calculate the Woodie pivot point and the associated resistance
and support levels for the present period.

Thermal Expansion Wave VDUB_v1TEW_V1
*** Modified, Madrid Ma Ribbon, Mashup. Using three colours indicating thermal expansion zones using Hull ma for the pivot points.
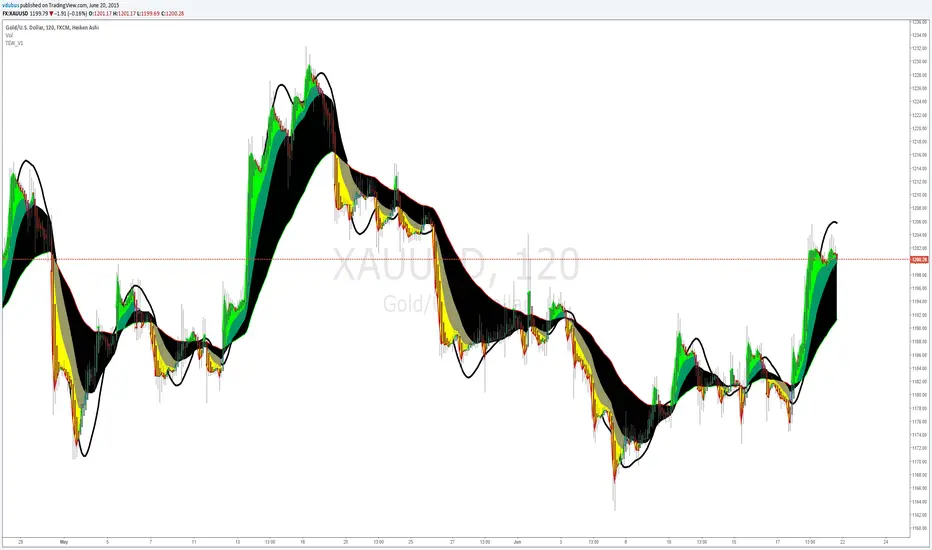
vdubongCustom script I fabricated which I use for Binary Trading on the 1m & 3m charts together with Price action & Time management but the principles are the same for all mediums. Use Price action buy/sell in the clear zones. Use the outer 'pink' horizontal lines (highs / lows / pivots points) to place SL's.
I personally run an additional BB 50/2 for clearer BB higher highs & lower low perspective, but it's not part of the script. Script variables are fully customisable.
I don't take ownership of any part of the script, I not a programmer /script writer just a dabbler. Enjoy :) - VDUBONG UPDATED

Aivance Opening Range & Vol FactorAivance Opening Range & Volume Factor
Overview
The Aivance Opening Range & Volume Factor is a comprehensive tool designed for Day Traders and Scalpers who rely on the "Opening Drive" or "Opening Range Breakout" (ORB) strategies.
The first candle of the trading session often sets the tone for the entire day. This indicator not only visualizes the price action of that critical first candle but also contextualizes the Volume to help you determine if there is enough institutional participation to sustain a trend.
Key Features
1. Opening Volume Factor
Unlike standard volume indicators, this tool calculates a specific Volume Factor for the opening candle:
Formula: (Volume of 1st Candle / Total Volume of Previous Day) * 100
Why it matters: A high Volume Factor (thresholds vary significantly depending on the chart timeframe and asset) suggests strong institutional interest immediately at the open. This often increases the probability of a sustained trend day rather than a choppy range day.
2. Automatic Session Detection
No manual time inputs are required.
The indicator uses time("D") to automatically detect the start of the trading day.
RTH vs. ETH: It adapts to your chart settings. If you use "Regular Trading Hours" (RTH), it marks the 09:30 NY open. If you use "Extended Trading Hours" (ETH), it marks the pre-market open.
3. Visual Opening Range
Box & Lines: Draws a box highlighting the High/Low and the Body (Open/Close) of the opening candle.
Extension: Extends support/resistance lines across the session to help identify breakouts or retests of the opening range later in the day.
4. Smart "Pullback" Logic (Optional)
This script includes a unique filter called "Show only on Pullback":
Default (False): The range is drawn immediately when the first candle closes.
Enabled (True): The range is hidden until the market prints a candle in the opposite direction of the opening move.
Strategy: This helps filter out impulsive moves and encourages trading the "retest" or the failure of the initial drive, rather than chasing the first tick.
How to Use
Trend Confirmation: Look for a breakout of the Opening Box combined with a high Volume Factor.
Support/Resistance: Use the extended gray lines (High/Low of the first candle) as key pivot points for stop-losses or entry targets.
Context: Compare the Volume Factor across different days to establish a baseline for your specific asset (e.g., what constitutes "High Volume" for NQ vs. ES vs. AAPL).
Settings
Colors: Fully customizable colors for Long (Bullish) and Short (Bearish) opening ranges.
Volume Factor: Toggle the text label on/off and adjust size/color.
Logic: Toggle the "Pullback" requirement on/off.
Disclaimer: This tool is for informational purposes only and does not constitute financial advice. Always manage your risk.

Target Lock Algo buy and Sell Signal by Amit NamdeoTarget Lock Algo: Professional Buy & Sell Signals
Target Lock Algo is a comprehensive, institutional-grade trading system designed to filter out market noise and provide high-probability entry signals with automated risk management. It combines Trend Flow, Market Structure (SMC), and Volatility Analysis into a single, clean interface.
Key Features
1. Precision Signal Engine
Trend-Following Logic: The core algorithm uses a smoothed Baseline to detect the dominant market flow. Signals are generated only when the trend flips (Green for Bullish, Red for Bearish).
"One-Shot" Execution: To prevent overtrading, the system never issues consecutive signals in the same direction. It forces a complete trend reversal before signaling again.
Whipsaw Protection: A built-in time filter (Min Bars) prevents signals from clustering together during choppy price action.
2. Institutional Filters (The "Safety Net")
200 EMA Major Trend Filter:
Buys are only enabled when price is ABOVE the 200 EMA.
Sells are only enabled when price is BELOW the 200 EMA.
This prevents catching falling knives or buying into a crash.
ADX Chop Filter:
The system actively monitors market strength using the Average Directional Index (ADX).
If the market enters a sideways "Chop Zone" (ADX < 20), all trading signals are hard-blocked.
Visual Aid: These zones can be highlighted with Gray Boxes to warn you to stay out.
3. Automated Risk Management (Target Lock)
When a signal is generated, the algorithm automatically calculates and draws the exact trade parameters on your chart:
⚡ ENTRY: The precise closing price of the signal candle.
🛑 STOP LOSS: Dynamic stop loss calculated using Market Volatility (ATR). If the market is volatile, the stop widens; if calm, it tightens.
🎯 TP 1, 💰 TP 2, 🚀 TP 3: Three take-profit levels calculated based on strict Risk-to-Reward ratios (1.5R, 2.5R, and 3.5R).
4. Premium Visual Interface
Glassmorphism Dashboard: A modern, transparent HUD in the top-right corner displays real-time data:
Current Trend: (Bullish 🟢 / Bearish 🔴)
Market State: (Active 🔥 / Ranging 💤)
Volatility: (Live ATR value)
SMC Overlay: Subtly plots pivot points and market structure breaks in the background to give you institutional context without cluttering the signals.
High-Contrast Design: Signals appear as modern "Neon Buttons," while TP/SL lines use rich, deep colors (Deep Emerald & Crimson) for professional visibility.
How to Trade with Target Lock Algo
Check the Dashboard: Ensure the Market State says "ACTIVE 🔥". If it says "RANGE 💤", be cautious.
Wait for the Button: Look for the "BUY NOW" (Neon Green) or "SELL NOW" (Neon Red) label.
Verify the Trend:
For BUY: Price should be above the white 200 EMA line.
For SELL: Price should be below the white 200 EMA line.
Execute: Enter the trade at the ⚡ ENTRY price.
Manage: Set your Stop Loss at the 🛑 SL line and take partial profits at TP 1 and TP 2. Leave a "runner" for TP 3 if the trend is strong.
